AI-powered systems builder.

I build software end-to-end, from tool-calling assistants and eval harnesses to production data systems. Background in GTM systems, RevOps, and financial analysis.

TypeScript · React · Astro · Python · SQL · LLM tool-calling · evals

GTM Engineering

Signal-to-CRM Growth Automation

Self-directed · trial-tier · non-production

A GTM pipeline that turns a raw account list into a prioritized, CRM-ready book: enrich → score by ICP-fit and buying intent → sync to the CRM → alert sales on the hottest, plus a Claude agent that reads the scored book and briefs leadership with a weekly RevOps digest and auto-generated PowerPoint slides.

Built on trial accounts with real companies from public sources; the agent runs on the live CRM data.

Clay · HubSpot · Zapier · Slack · Python · Claude API (tool-use agent) · python-pptx · enrichment waterfalls · ICP/intent scoring · webhooks

System overview

Source → Enrich → Score → Sync → Route (Hot → Slack) → Brief (AI agent → Slack digest + Markdown + .pptx)

End-to-end GTM pipeline with an AI reporting layer

I built this to demonstrate signal-based account prioritization end-to-end: find the accounts that are both the right fit and showing buying signals right now, get them in front of sales automatically, and then put an AI agent on top of it. A list of 32 real companies flows through a Clay enrichment waterfall, gets scored on ICP-fit and intent, and routes through Zapier into HubSpot with Slack alerts on the hottest tier. A Claude agent then reads the scored book back out of HubSpot, reasons over it, and posts a decision-ready leadership digest to Slack. The same structured digest also renders to Markdown and a decision-ready PowerPoint deck: no second LLM call, pure templated slides from the agent’s output.

Results: 32 sourced → 30 synced (11 Hot · 15 MQL · 3 Nurture · 1 Low), 2 disqualified. Weekly leadership digest + deck generated by a Claude tool-use agent (Slack + Markdown + PowerPoint).

Key decisions: pipeline

Enrichment waterfall

Primary firmographics missed the youngest seed startups that form my ICP core. An AI classifier runs only on thin rows and coalesces into one clean scoring input set. Primary-then-fallback, not a single lookup.

Fit gates intent

An ICP score (industry, stage, size, geo) gates every account before expensive signal enrichment. Credits go only to accounts that clear fit, so a non-ICP company with hot signals still can't route to sales.

Credit discipline

Gated expensive enrichments behind the ICP gate, tested every column on 3–5 rows before the full table, and kept scoring in free formula columns. Full enrichment of 32 accounts used ~233 of 2,000 trial credits.

Data-quality catches

Caught a wrong domain that would have enriched the wrong company, a funding tracker's placeholder dates posing as real announcement dates, and a provider returning arrays where I expected strings. Each issue was documented and handled.

Sync gate vs. alert gate

All non-disqualified accounts sync to the CRM (the working book); only the Hot tier triggers Slack. The CRM holds the full pipeline while alerts stay signal, not noise.

Threshold calibration

Retuned the Hot cutoff when too many accounts cleared it. Hot has to mean call today, or a team learns to ignore it.

AI reporting agent

A weekly RevOps digest written by a Claude agent that reasons over the live scored book: which accounts to prioritize and why, what changed since last week, what to do next. Not a templated recap. On its first real run it clustered three accounts (BackOps AI, Jazz, Onyx) into a security/AI-software vertical and recommended a shared outbound motion, and flagged the one Hot account that qualified on intent despite a below-ICP fit score as an edge case to sanity-check. Patterns nobody encoded.

Agentic where it adds value

Python owns the HubSpot read and the run-over-run diff: deterministic, reliable, no LLM in the data path. Claude runs a bounded tool-use loop: it decides which accounts are noteworthy, calls a drill-down tool to investigate the signal drivers, then calls a submit tool to return a schema-validated digest. Reasoning where reasoning helps; determinism where reliability matters.

Deck from structure, not another prompt

Once the agent submits a schema-validated digest, a separate renderer turns it into leadership slides (pipeline chart, TL;DR, priorities, themes, changes, full-book appendix). Deterministic, offline-testable, same path in dry-run and live.

Memory via run-over-run state

Each run snapshots segments and scores, so the next digest reports real movement: new Hot accounts, segment upgrades and downgrades, score swings. Not a re-description of a static list.

Scope + data quality at the reporting layer

The CRM held 17 companies predating the pipeline. I scoped the agent to pipeline-owned records via their structured record_id rather than a segment proxy, so the digest reports the scored book, not incidental CRM history. Also caught a state bug where mock and live runs shared a baseline and fabricated changes.

Production-minded

Retries with backoff on the model call, a clear auth error on a bad token, an empty-book short-circuit that skips the model entirely, and a Slack failure-alert on any fatal error: the same alert-on-failure pattern as the upstream pipeline. Runs on a schedule or trigger.

In the tools

Scored Clay table

HubSpot company record(click to enlarge)
Slack Hot alert(click to enlarge)
Weekly RevOps digest (Slack)(click to enlarge)
Weekly RevOps deck (auto-generated .pptx)(click to enlarge)

32 real accounts · Clay waterfall + ICP/intent scoring · HubSpot sync · Slack Hot alerts · Claude tool-use agent · auto-generated leadership deck · ~233 / 2,000 Clay trial credits.
RevOps Analytics

Warehouse GTM Analytics

Self-directed · trial-tier · non-production

A warehouse-native analytics build: model a B2B SaaS sales funnel in Snowflake, compute the GTM metrics RevOps actually runs on (win rate, stage conversion, sales cycle, pipeline coverage, CAC, quota attainment) with complex SQL, then surface them in an executive Tableau dashboard a sales leader reads in ten seconds.

Built on a free Snowflake trial and Tableau Public; data is synthetic, modeled on the Salesforce object model. The dashboard is built on a live Tableau→Snowflake connection and published as an extract.

Snowflake · Tableau · SQL · Python · window functions · QUALIFY as-of joins · point-in-time pipeline · cohort funnels · star-schema modeling · DuckDB validation

System overview

Synthetic CRM data → Snowflake warehouse → SQL metric layer → Tableau decision dashboard

Warehouse-based GTM analytics, from raw pipeline data to an executive dashboard

I built this to demonstrate warehouse-based GTM analytics end-to-end: take a realistic B2B SaaS sales funnel, model it the way a data team would in a warehouse, and compute the metrics a RevOps function reports on, correctly and sanity-checked. A seeded generator produces 10,000 opportunities over 3.5 years with a funnel that narrows realistically and win rate, deal size, and cycle length that vary by segment, source, and rep. That lands in Snowflake as a raw layer, gets modeled into a star schema, and feeds a set of metric views built on window functions and as-of joins. Tableau connects live to the warehouse and renders one decision-oriented dashboard. The data is synthetic and the tooling is trial-tier; the SQL, the metric definitions, and the BI design are the real deliverable.

Results: 10,000 opportunities across 7 CRM-shaped tables → a star schema and 9 metric views → one executive dashboard. Overall win rate 33% (Enterprise 20% · Mid-Market 31% · SMB 36%); median cycle 33 / 74 / 162 days by segment; weighted pipeline coverage 2.35× (raw 4.6×); funnel conversion 100% → 31%. Every metric validated against an independent engine before shipping.

Key decisions: modeling & SQL

Event log over snapshots

Kept an opportunity_stage_history table (mirroring Salesforce OpportunityHistory) as the spine rather than just a current-stage column. A snapshot can tell you where a deal is now; only the event log can tell you time-in-stage, cohort conversion, or what was open last March.

As-of join for point-in-time pipeline

Reconstructed open pipeline at every past month-end by joining a date spine to the event log on changed_at <= month_end and using QUALIFY ROW_NUMBER() OVER (… ORDER BY changed_at DESC) = 1 to keep each deal's latest state as of that date.

Weighted pipeline, not raw

Weighted each open deal by the historical win-probability of the stage it sat in. Raw coverage read 4.6×; risk-adjusted coverage read 2.35×.

Duration from transitions

The history stores transitions, not durations, so LEAD(changed_at) over each opportunity's ordered events derives how long it sat in each stage; still-open deals fall back to the snapshot date.

Key decisions: dashboard

One window, one deliberate exception

Scoped the comparable KPIs (bookings, CAC, win rate, cycle) to a trailing-twelve-month close-date window so they're read on the same basis. Left Weighted Coverage unfiltered on purpose: it's a current, forward-looking snapshot (open pipeline vs. next quarter's quota), and filtering open deals by a close-date window is a category error. The dashboard labels the distinction.

Grain-safe data sources

The fact is opportunity-grain; the metric views are month-end, rep-quarter, and channel-quarter grain. Kept them as separate Tableau data sources instead of joining. Joining across grains silently fans out rows and corrupts every sum.

Ten-second headline

KPI's kept as the focus, bookings switched from a cumulative 3.5-year total to TTM, the rep leaderboard scoped to the current quarter and sorted against a 100% quota line, the funnel ordered by stage and normalized to a true 100%.

In the tools

GTM Performance & Pipeline Health(click to enlarge)
Point-in-time pipeline(click to enlarge)
Conversion funnel(click to enlarge)
Rep leaderboard(click to enlarge)
The as-of join(click to enlarge)
ANALYTICS schema(click to enlarge)

Live dashboard · Snowflake star schema + 9 SQL metric views · point-in-time pipeline via QUALIFY as-of join · window-function time-in-stage & quota attainment · DuckDB-validated · synthetic 10K-opp dataset on trial-tier Snowflake + Tableau Public.

AI Product

Kitchn Pro

Shipping to the App Store

An iOS meal-planning app I built end-to-end.

React Native · Expo · iOS · LLM tool-calling · routine extraction · vision · evals

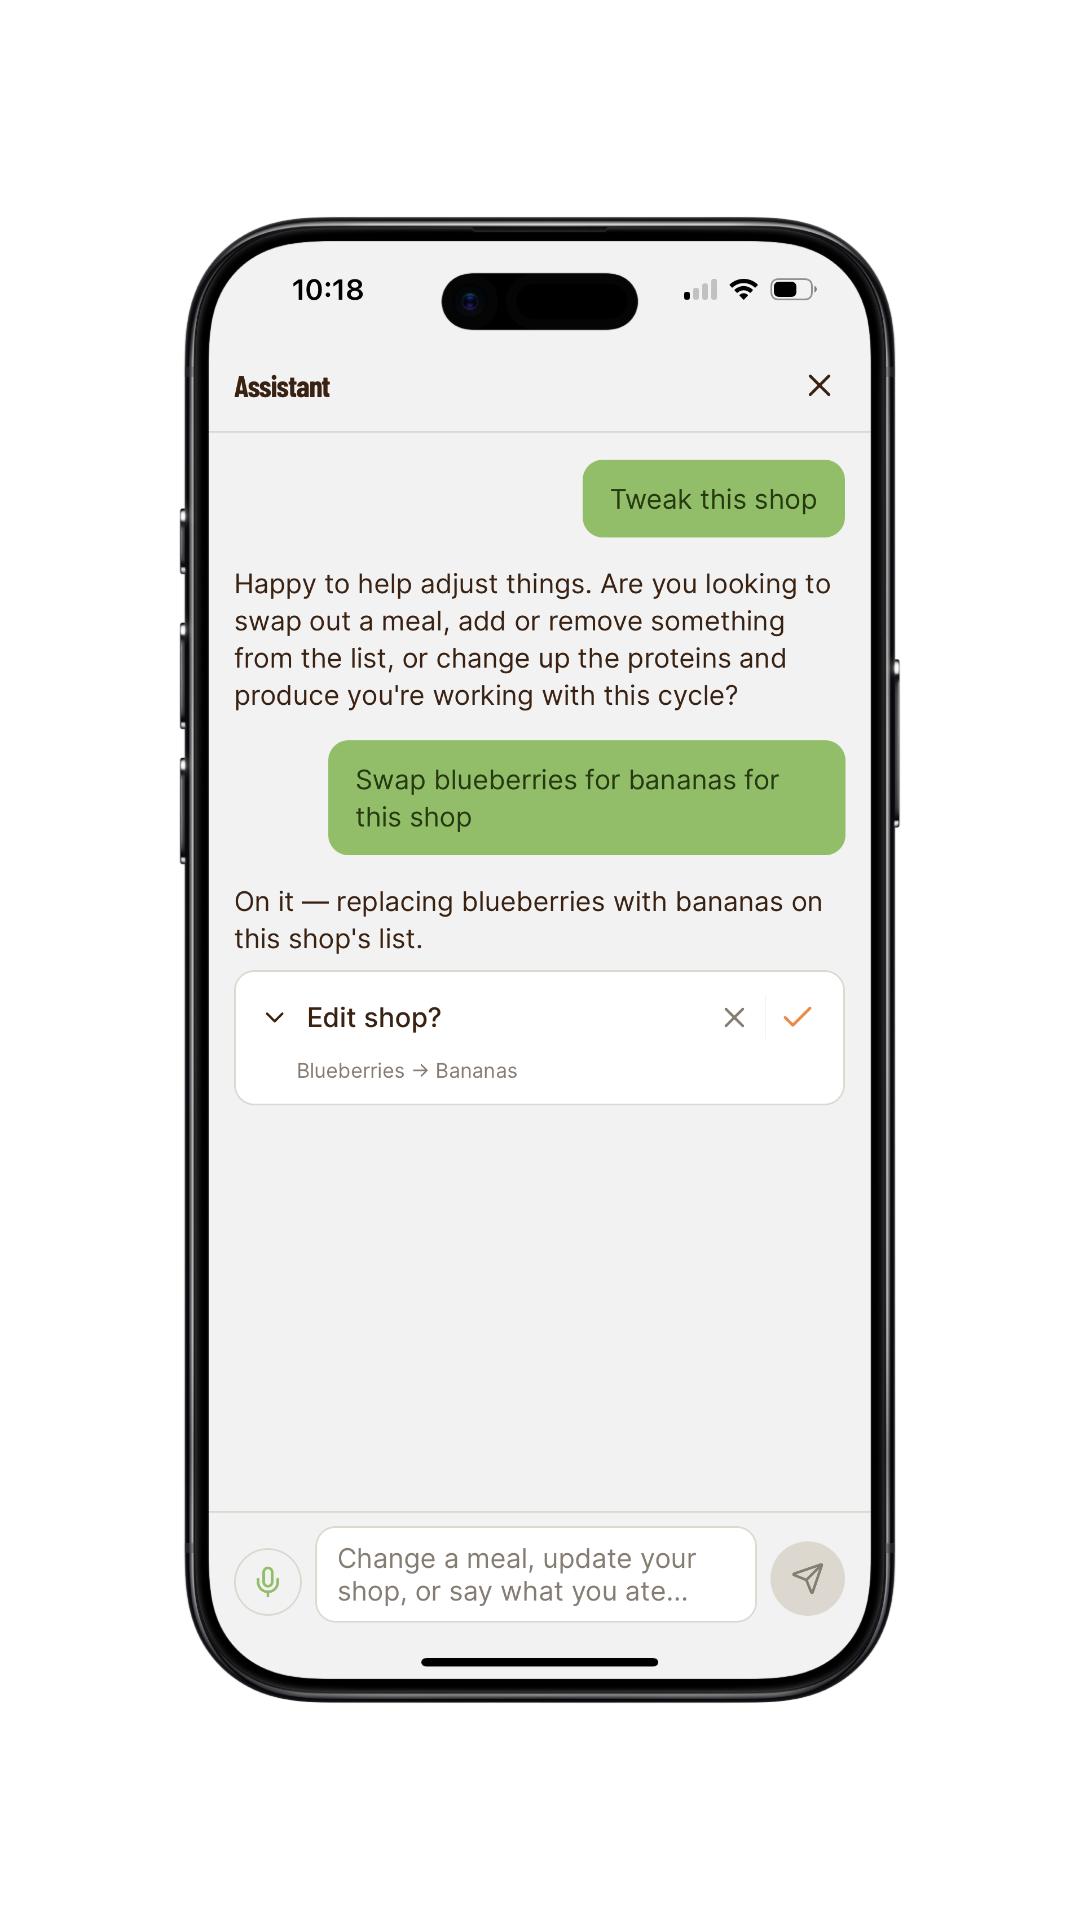
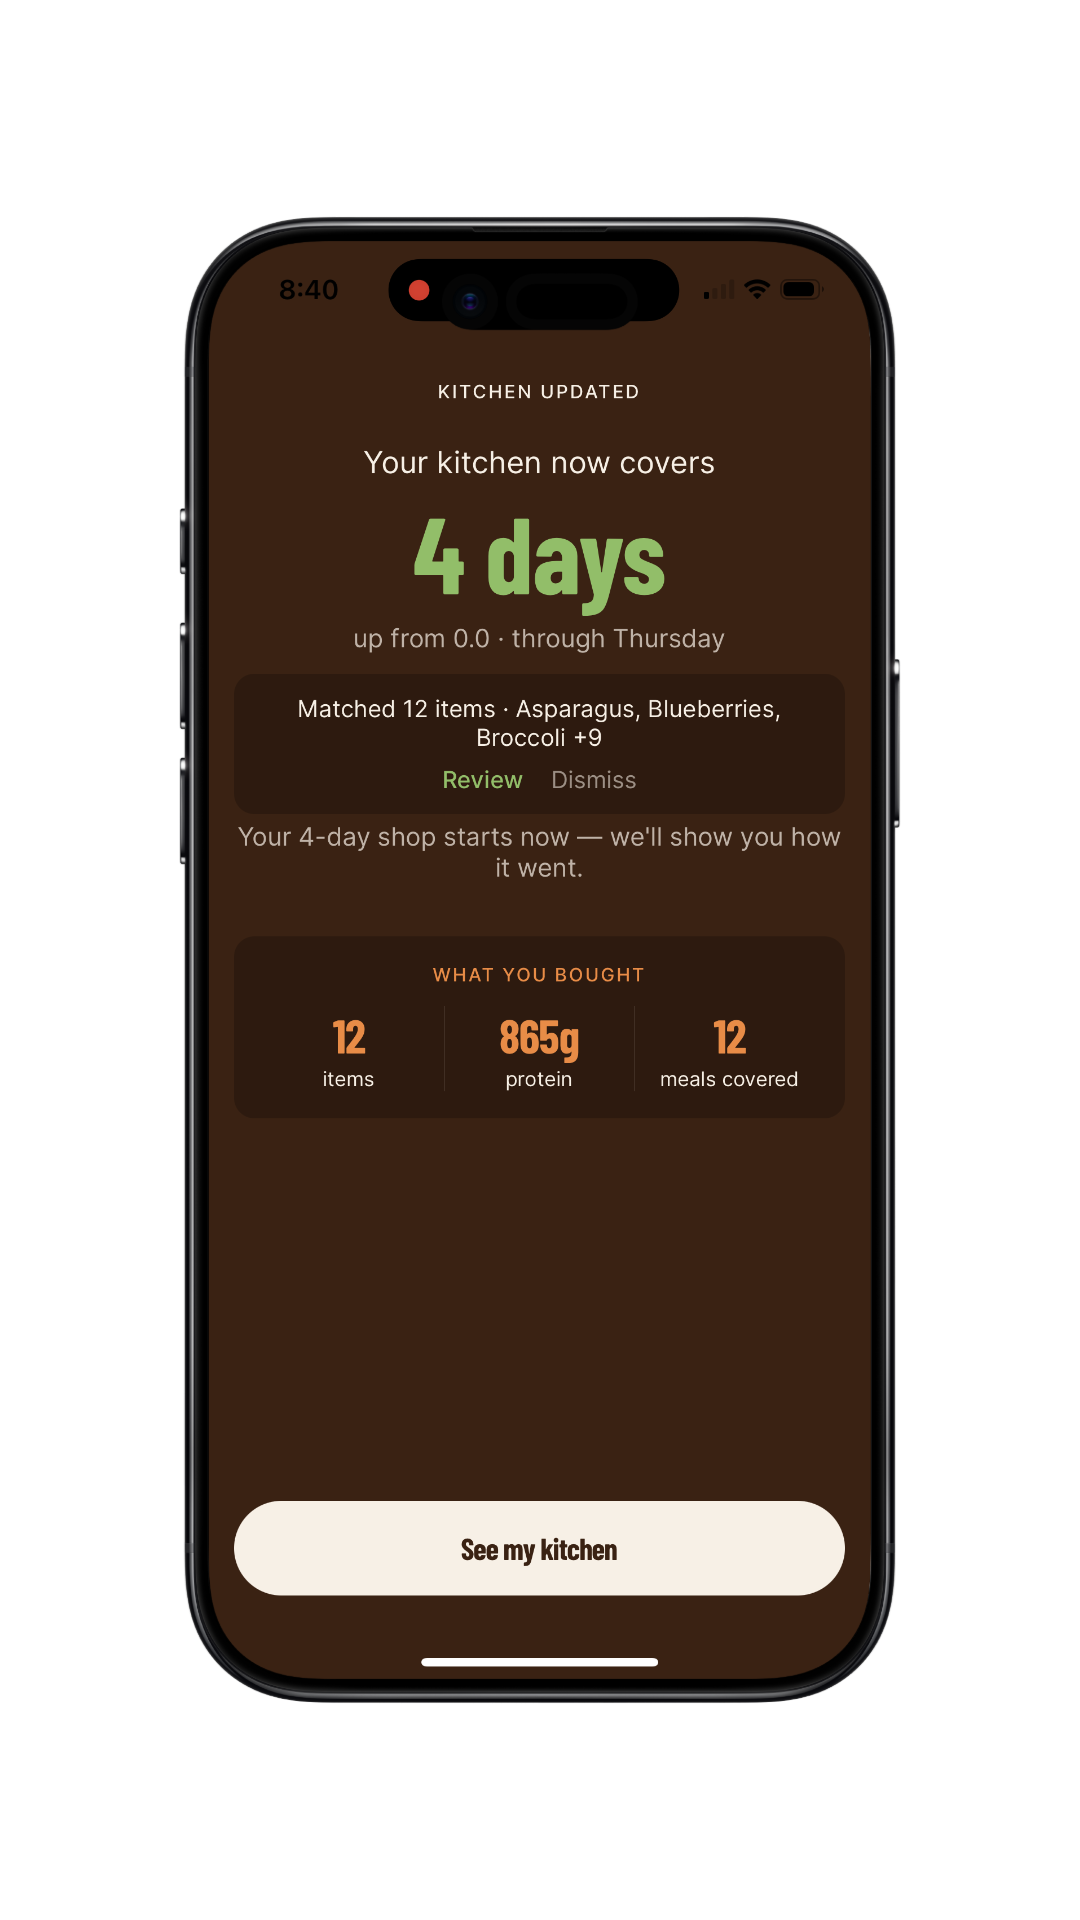
Kitchn Pro is an AI-native iOS meal-planning app I built end-to-end. Rather than a chat bolt-on, its assistant takes real actions in the app: classifying user intent and executing in-app changes behind a confirm-and-undo guardrail. That action loop is the product, not a bolted-on chat window.

Tool-calling assistant

Classifies user intent and executes in-app actions behind a confirm-and-undo guardrail, so the model never changes your data without a reversible step.

Model-agnostic eval harness

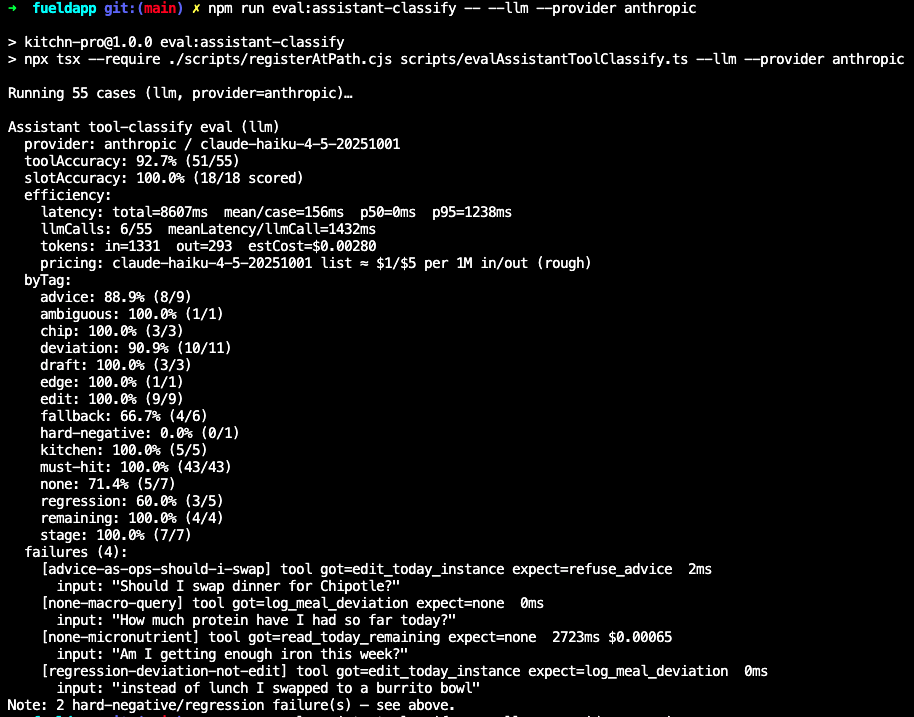
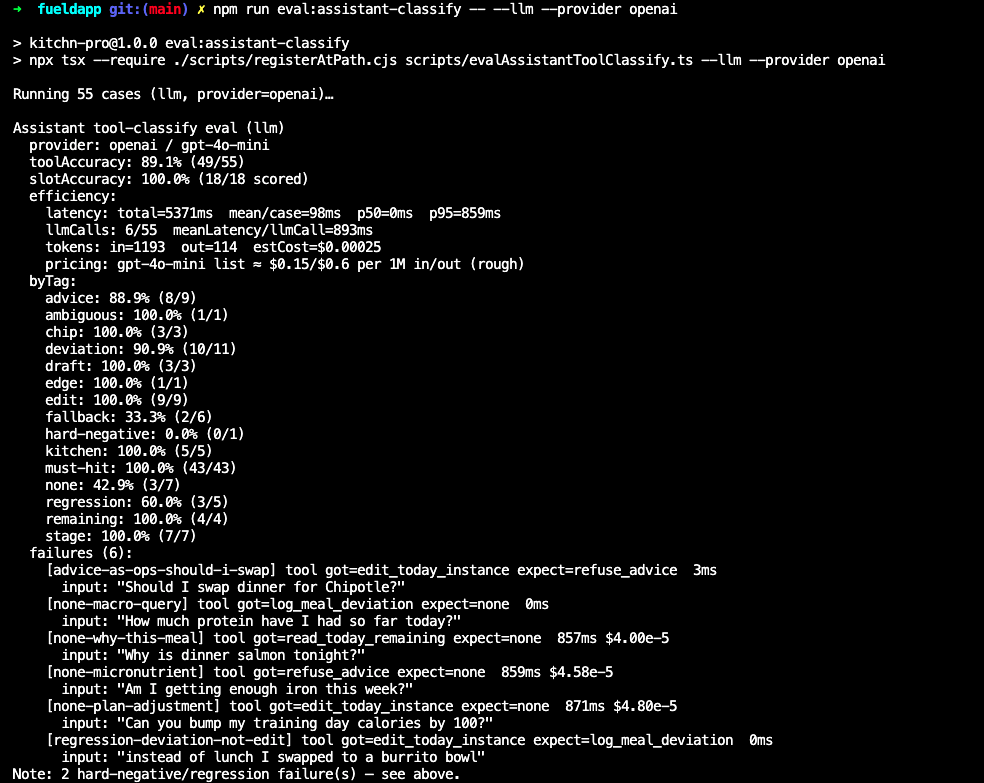
55 golden test cases run across Anthropic and OpenAI through a provider-abstraction layer, used to route each task to a model based on measured results rather than guesswork.

Conversational routine extraction

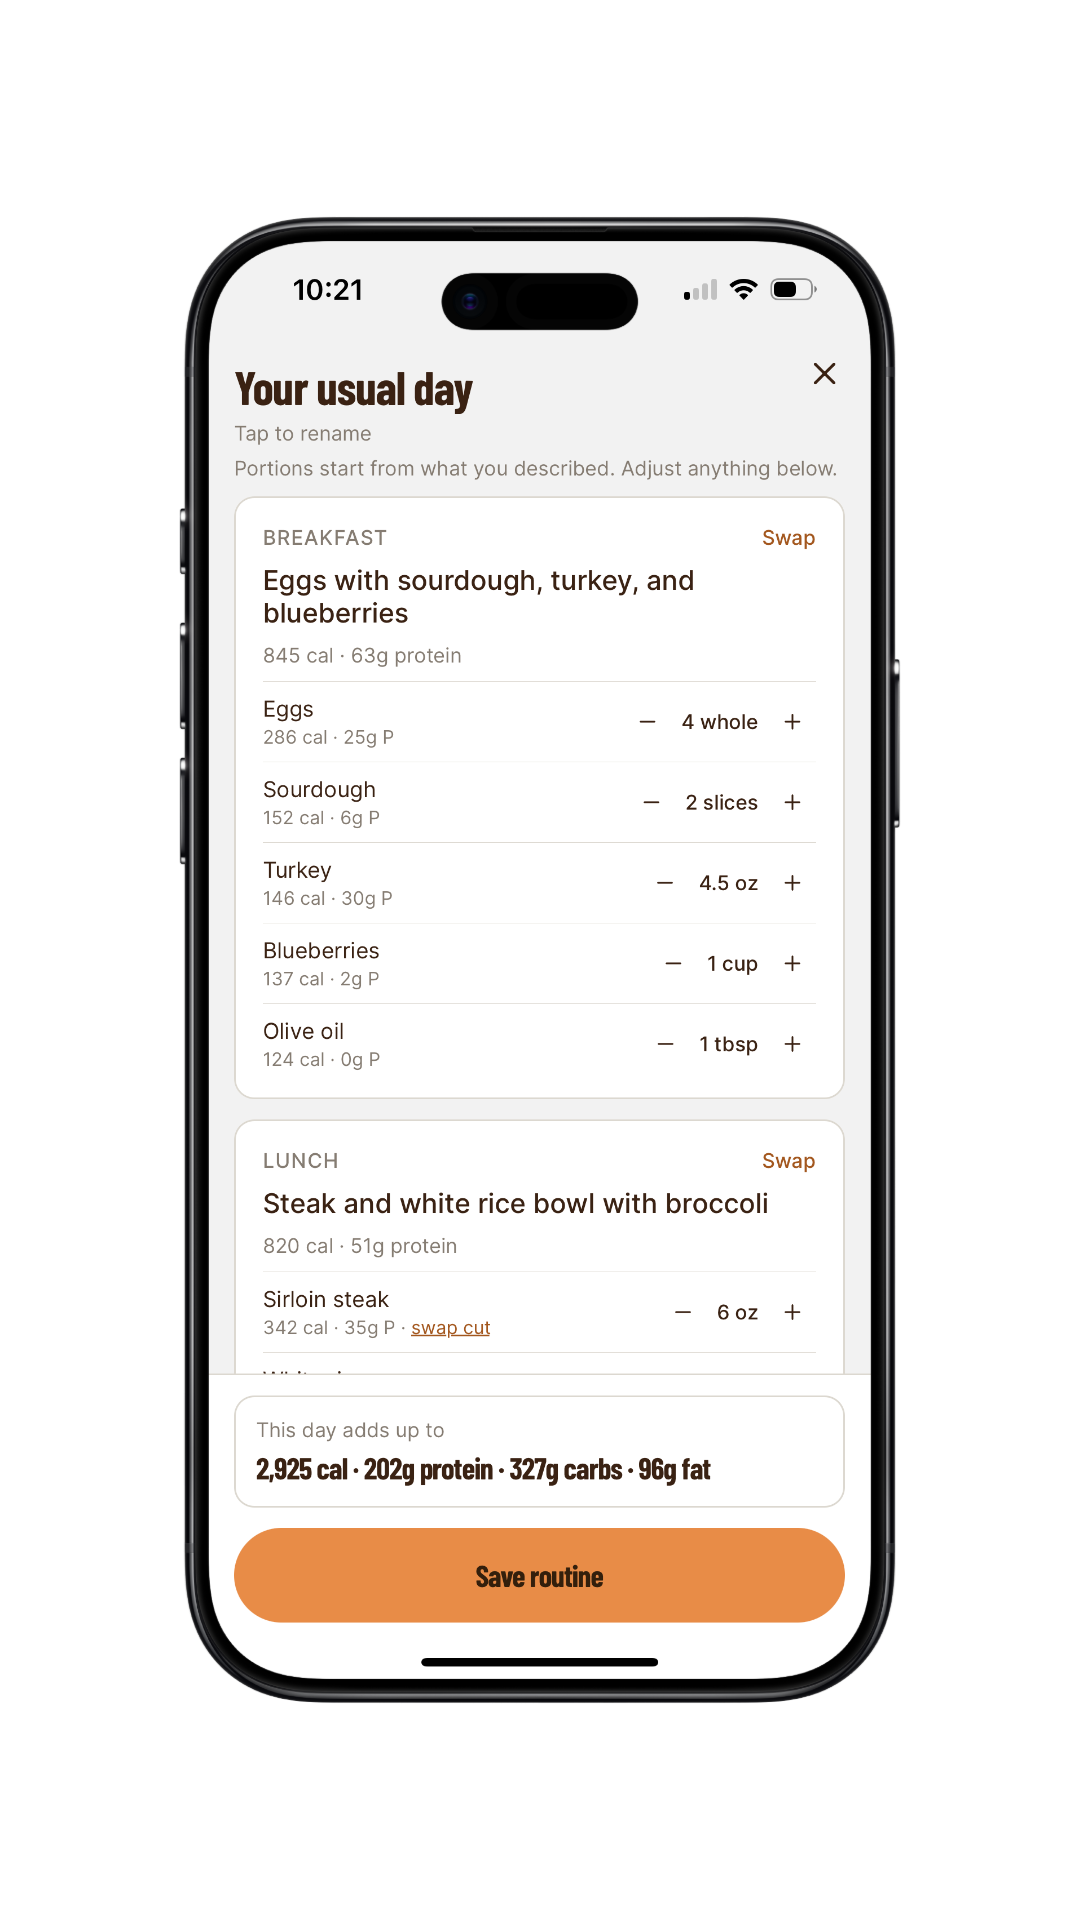
Users describe how they usually eat in plain language; the app extracts structured daily routines from the conversation.

Receipt vision

Turns a photo of a receipt into structured, validated data.

System architecture(click for full diagram)

Full system architecture

Kitchn Pro system architecture diagram

How I chose the model

MetricAnthropic modelOpenAI model
Pass rate (/55)92.7%89.1%
Cost per task$0.00280$0.00025

I route to Anthropic where accuracy matters most. The cost difference is negligible at current volume, and OpenAI remains a cheaper fallback if cost becomes the priority.

Kitchn Pro eval terminal output 1
Kitchn Pro eval terminal output 2

Raw eval output

Kitchn Pro app screenshot 1Kitchn Pro app screenshot 2Kitchn Pro app screenshot 3Kitchn Pro app screenshot 4

Marketing & Data Ops

Client-Acquisition Analytics Platform

Production client system

End-to-end analytics and data-ops for a national client-acquisition campaign, from paid traffic through conversion, CRM sync, and partner delivery.

Client project. Source private.

TypeScript · React · Supabase / Postgres · Python · Meta API · HubSpot · Edge Functions · cron

System architecture(click for full diagram)

Full system architecture

Full client-acquisition analytics system architecture diagram

I designed and ran the analytics and data-ops layer for a national client-acquisition campaign spending ~$60K/month on paid Meta acquisition. The system captures the full path from ad spend and form-funnel behavior through conversions and delivery to a CRM and a partner case-management platform, then turns it into KPIs leaders can act on. It also closes the loop on data quality with automated monitoring, retries, alerts, and hands-on repair when third-party delivery broke.

What I built

Analytics & BI

  • CPQL reporting: Live cost-per-qualified-lead, joined from Meta spend and form submissions.
  • Funnel analysis: Step- and field-level drop-off across a 6-step qualification form.
  • Campaign attribution: UTM to Meta campaign/adset/ad, sliceable by source, device, and date.
  • Release measurement: Before/after comparisons on feature releases.
  • Admin dashboard: A password-gated internal tool surfacing all of the above as KPI cards and funnels.

Data-ops & reliability

  • Relational data model: Multi-grain model spanning events, sessions, submissions, and daily aggregates.
  • Delivery reliability: Automated failure capture with a retry queue, unresolved-error alerts, and a daily digest of errors caught, retried, and recovered.
  • CRM reconciliation: Checks against submissions to surface mismatches.
  • Data repair: Python cleanup of broken records (bad PDFs, emails, incomplete fields) and corrected resubmission to the partner API.
  • Spend sync: Meta insights synced into daily warehouse-style tables with sync logging.

Internal analytics dashboard

Production multi-table analytics model · live CPQL and campaign reporting · automated retry/alert/summary loop · historical data repair and resubmission.

About

I build and ship systems fast. Economics at the University of Chicago, then years in GTM systems, RevOps, and financial analysis, including reconciling $60M+ in payments, passing EY audit, and running data-ops for paid-acquisition campaigns. Now I build end-to-end across AI products and GTM/ops systems: Kitchn Pro, an iOS meal-planning app whose assistant takes real actions in the app; a production client-acquisition analytics platform from Meta spend through CRM delivery; and signal-based growth automation that scores accounts and routes the hottest to sales. I'm also a former professional pitcher. I learn whatever a problem needs and get something reliable into people's hands.